Defocus curves: what do they tell you about lens implants?
A defocus curve is a graph showing how clearly someone can read an eye chart as the focusing demand changes. After intraocular lens surgery, it helps show the range over which an implanted lens provides useful sharpness—from distance towards computer and reading distances.


It is a useful part of comparing lens implants. But it does not, by itself, tell you how comfortable your night vision will be, whether you will notice haloes, or how often you will need glasses.
What is a defocus curve?
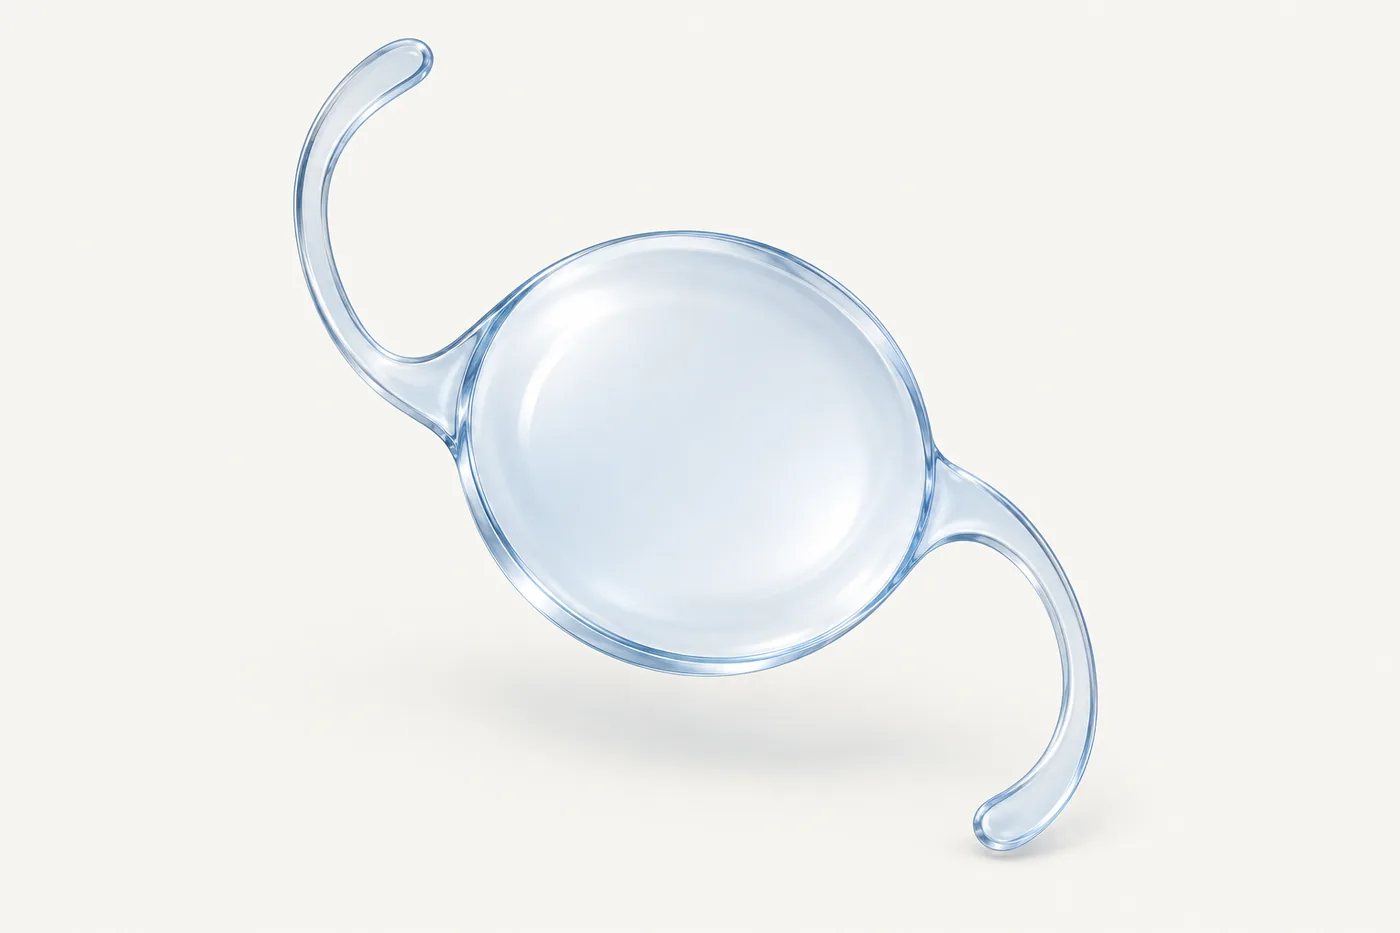
An intraocular lens, or IOL, replaces the eye's natural lens during cataract surgery or refractive lens exchange. Different IOL designs distribute their focusing ability differently. A defocus curve helps describe that difference.
During a typical test, the person looks at an eye chart at a fixed distance. The examiner first finds the glasses correction that gives the clearest distance vision. Trial lenses of different strengths are then placed in front of the eye, and the smallest letters the person can read are recorded each time.
The chart stays in place. The trial lenses change the focusing demand, providing an approximation of looking at different distances. Each result becomes a point on the graph. Joining the points produces the curve.
Testing can involve one eye or both eyes together. Published curves often show the average result from a group of people after surgery. They are not a scan of an individual implant, and they cannot promise what your own vision will be.
How do I read the graph?
Start with the axes, before comparing the lines.
Across the graph: focusing demand
The horizontal axis usually shows defocus in dioptres, abbreviated D. Zero is the distance reference. Moving into negative numbers represents progressively closer viewing demands.
As a practical approximation:
- −0.50 D: about 2 metres.
- −1.00 D: about 1 metre.
- −1.50 D: about 67 centimetres—often relevant to a computer screen.
- −2.00 D: about 50 centimetres.
- −2.50 D: about 40 centimetres—a common reading test distance.
- −3.00 D: about 33 centimetres.
These conversions assume that the graph is referenced to optical infinity, meaning a very distant target. Research protocols using a chart a few metres away need to account for that testing distance, so the labels are approximate guides rather than a measurement of your preferred working distance.
Some graphs also include positive defocus. This tests blur tolerance on the other side of the distance reference; it does not represent another set of ordinary near viewing distances.
The dioptres on this graph are not the power of the implanted lens. Implant power is calculated separately from measurements of the eye.
Up and down: clarity on the eye chart
The vertical axis commonly uses a scale called logMAR. The name is technical, but the important rule is simple: a lower numerical logMAR value means better visual acuity.
- 0.0 logMAR corresponds to 6/6 vision, also called 20/20.
- 0.3 logMAR is approximately 6/12, or 20/40.
- A value below zero means even finer detail was resolved on the chart.
Zero does not mean “no vision”, and 0.2 does not mean “20 per cent vision”. Check how the graph is drawn: some put better vision at the top, others at the bottom. In the illustration below, better vision is at the top.
How wide is the useful part of the curve?
Researchers may count the range over which vision stays at or better than a chosen level—for example, 0.2 logMAR, approximately 6/9.5 or 20/32.
A wider range at that level can be helpful. However, that cut-off does not guarantee comfortable small-print reading or safe driving. Those tasks involve more than recognising letters on a chart.
What does the shape tell me?
The shape helps explain where a lens design concentrates its performance. The examples below show general concepts. They are not a ranking of lenses, and individual products within a category can have different curves.
A standard monofocal lens has its best performance around one main focus. When it is targeted for distance, vision usually becomes less sharp as the test moves towards near. There is still some tolerance around the main focus; it is not a single perfectly sharp point surrounded by complete blur.
An enhanced monofocal lens may extend that region towards intermediate distances. This does not make every enhanced monofocal equivalent to an EDOF lens, or establish that reading glasses will be unnecessary.
An extended depth of focus, or EDOF, lens aims to provide a broader range, particularly from distance through intermediate. How far this extends towards near depends on the design and the person.
A multifocal or trifocal lens provides more than one focal region. Its curve may show relatively good acuity at distance and near, with varying intermediate performance. A trifocal does not have to produce three distinct visible peaks: the design, test spacing and averaging of patient results all affect the shape.
You can read more about the options in the guides to lens implants, EDOF lenses and multifocal lenses.
Monofocal
One main focus, set for distance.
Enhanced monofocal
The same focus, stretched a little towards arm's length.
EDOF
A broader region from distance through intermediate.
Trifocal
More than one focal region, so the line rises again.
Why can a good curve still mean wearing glasses?
Reading small, high-contrast letters in controlled lighting is only one part of seeing well. A conventional defocus curve does not directly measure:
- Contrast: distinguishing an object from a similar-looking background.
- Night-time symptoms: haloes, glare or starbursts around lights.
- Reading comfort: following small print for a long time, rather than identifying a few letters.
- Your everyday tasks: the lighting, print size and working distances you use.
These need separate measurements and discussion. A lens study can report both a broader curve and reduced spectacle use, but one result cannot simply stand in for the other.
The glasses prescription left after surgery also matters. A distance-corrected curve is measured with any remaining distance prescription corrected during the test. It therefore does not necessarily show how that person sees without glasses.
Sometimes one eye is deliberately targeted slightly short-sighted to help with near vision, an approach called mini-monovision. Correcting both eyes fully for distance during testing can remove that intended contribution. To understand the whole strategy, it is useful to consider vision with both eyes open and without glasses, as well as the corrected curve.
A broad curve also does not prove that an implant changes focus like a young natural lens. Range of focus and active focusing are different things.
Can I compare graphs from different studies?
Carefully. Two attractive-looking curves may have been produced under different conditions. Before concluding that one lens performs better, ask:
- Were both graphs measured with one eye, or with both eyes together?
- Was the remaining glasses prescription corrected? Were the intended targets the same?
- Were the lighting, chart distance and test methods comparable?
- Were similar patients tested at a similar stage after surgery?
- Do the axes use the same scale and direction?
A smooth line can also look more precise than the measurements behind it. Closely spaced testing points give more detail than widely spaced points.
Most published curves are group averages. Some people will do better and some worse. If the graph has error bars, check what they mean: a confidence interval describes uncertainty around the average, while a standard deviation describes variation in the measured results. Neither is a promise about your eye.
How should I use a curve when choosing a lens?
Use it to make the conversation about your vision more specific.
Measure roughly how far away you hold your phone or book, and where your computer screen sits. Then ask which part of the curve relates to those tasks—and what the separate evidence says about glasses use, contrast and visual disturbances.
Eye health remains central. Results from carefully selected study participants may not apply in the same way when there is macular disease, a corneal problem or another condition affecting vision. Astigmatism also needs separate attention; the usual defocus curve does not decide whether a toric lens is needed.
Useful questions for a lens-planning discussion include:
- Which of my usual tasks is this lens most likely to help with?
- For which tasks should I still expect to use glasses?
- What trade-offs might I notice in dim light or at night?
- Does the evidence apply to the health of my eyes and the planned prescription?
The aim is to choose a lens and focusing plan that suit your eyes and priorities. A defocus curve helps explain one part of that choice; it does not establish that surgery is needed or identify a best lens for everyone.
Sources and further reading
- Testing and curve analysis: Law and colleagues, Optimising curve fitting techniques , 2022; Wolffsohn and colleagues, Exploring the optimum step size for defocus curves , 2013.
- Examples of measured lens profiles: McCabe and colleagues, a randomised EDOF registration study , 2022; Yangzes and colleagues, an enhanced-monofocal comparison , 2020; and the FDA's PanOptix clinical evidence summary , 2019.
- Prescription targets and patient experience: Sandoval and colleagues, defocus curves and satisfaction with different targets , 2020.
- Methods overview: Rodríguez-Vallejo and colleagues, Refraction and defocus curves , 2023.